
The v2 screener flow is designed to remove the blank page problem. You can still write advanced technical queries, but you no longer have to start there. You can start from a curated screen, customize the rules, run the result table, save the logic, and turn the best matches into watchlists or TradesViz planning files.
This guide covers the full screener workflow in EZStockScreener v2: Screen Library, Advanced Screener, Results, queues, charts, saving, and examples.
Screenshot placeholder: Screener flow overview showing Screen Library to Advanced Screener to Results to Symbol Review.
Start from the Screen Library
The fastest way to run a screener is to open Screen Library. The library contains ready-made workflows across technical, fundamental, and hybrid screens.
Common starting screens include:
- 20-Day High With Volume: Finds stocks closing near short-term highs with stronger volume.
- Relative Strength Breakout: Focuses on higher-score momentum names with enough liquidity.
- Uptrend Pullback to 50 SMA: Finds stocks that are still in a longer-term uptrend but have cooled off.
- Quality Growth in Uptrend: Combines profitability, growth, trend, and liquidity.
- Reasonable Value With Earnings: Looks for profitable companies with valuation limits.
- Dividend Yield With Payout Discipline: Screens for yield while checking payout and tradeability.
- Weak Trend Risk Review: Flags weak names for caution, exclusion, or separate review.
- TradesViz Planning Queue: Builds a balanced shortlist intended for watchlists, plans, and journal review.
Screenshot placeholder: Screen Library card for 20-Day High With Volume with rules, matches, and actions.
Each library card gives you three important actions:
- View matches to open the results table immediately.
- Customize to open the rules in Advanced Screener.
- Run backtest to check historical behavior.
If you are new to v2, do not start by creating a complex screen. Pick one simple screen, open its matches, and review how the table explains each result. Once that makes sense, customize the rules.
Use mode filters
Screen Library supports three modes:
- Technical: Price, volume, trend, moving averages, RSI, MACD, crosses, and similar market behavior.
- Fundamental: Company metrics like revenue growth, earnings, ROE, margins, debt, PE, market cap, and dividends.
- Tech + fundamentals: A combined flow where business quality and tradeability both matter.
Example: if you want a swing trading list, choose a hybrid screen like Quality Growth in Uptrend. That avoids the common mistake of finding a good business that has no current trading setup, or finding a strong chart in a weak business.
Advanced Screener setup controls
Open Advanced Screener when you want to build or customize a screen.
Screenshot placeholder: Advanced Screener top setup section with market, preset, base screener, score, liquidity, risk, screen date, and chart toggles.
The top controls decide how the screen runs:
- Market: US, Canada, India, or Australia.
- Start from a preset: Load a known workflow before editing.
- Base screener: Add saved logic as a base layer for the current screen.
- Screen name: Name the setup before saving it.
- Minimum score: Higher scores return fewer, cleaner names.
- Liquidity: Filter out thin names when you need tradable lists.
- Risk state: Keep all names or require cleaner risk conditions.
- Screen date: Run the screen as of a selected EOD date.
- Draw rule indicators: Show rule-related indicators on result charts.
- Volume on charts: Include volume panels when reviewing chart view.
- SMA overlays: Add moving average context on charts.
- Include ETFs: Include or exclude ETFs from the result set.
The Base screener option is useful when you have a common filter you always want to apply. For example, you may have a base screener for liquid US stocks over $10. You can apply that base, then add a momentum or value condition on top.
Technical conditions
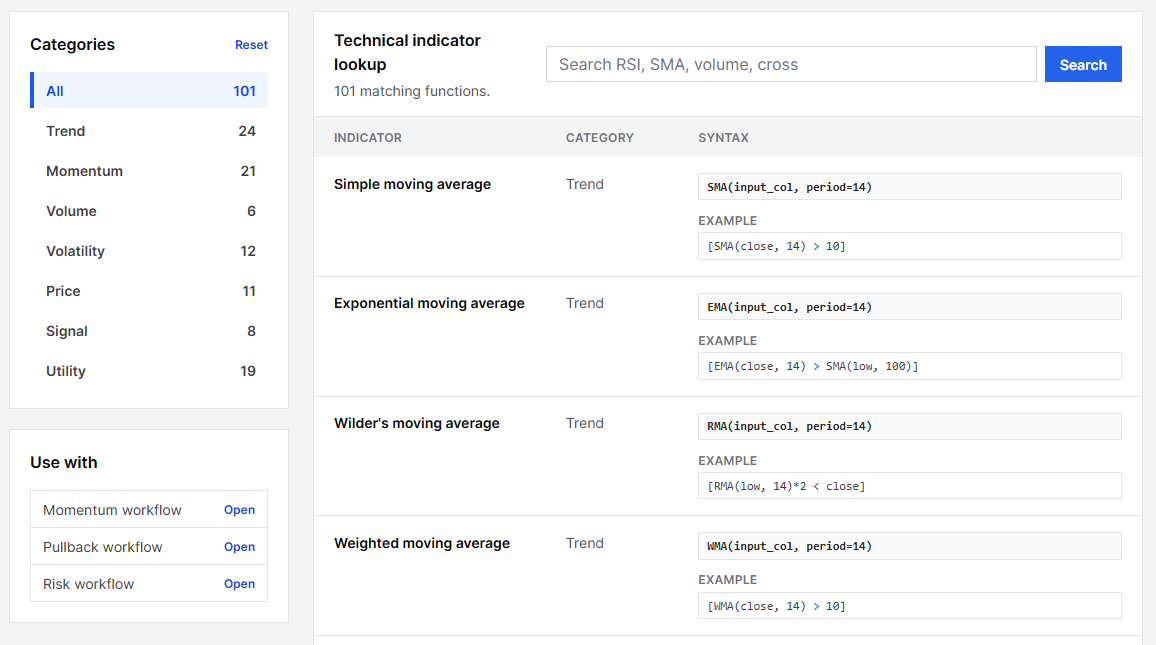
The Technical column covers price and indicator logic. Use Add condition to search the technical condition library. You can add common conditions, edit them, reorder them, or remove them.
Screenshot placeholder: Technical condition builder with a few rows and the condition search popup.
Simple technical examples:
AND [volume > 100000]
This finds stocks above $5 with volume above 100,000 shares.
AND [close > SMA(200)]
AND [volume > 250000]
This finds stocks above both the 50-day and 200-day moving averages with enough volume for review.
AND [close > SMA(50)]
This finds stronger momentum names that are still above the intermediate trend.
Use the Text view if you already know the query format. Conditions stay inside square brackets and are joined by AND or OR.
Fundamental conditions
The Fundamental column covers business metrics. The builder handles field selection, operators, values, and units. For example, percent inputs can be shown as 10 for 10%, while market cap is entered in millions.
Screenshot placeholder: Fundamental condition builder showing ROE, revenue growth, market cap, and PE conditions.
Simple fundamental examples:
ROE >= 10%
Profit margin >= 5%
Revenue growth >= 5%
This is a basic quality screen. It does not guarantee a good trade, but it starts with companies that have better profitability and growth characteristics.
Trailing PE > 0
Trailing PE <= 25
EPS > 0
This is a simple value screen. It removes companies with negative earnings and caps valuation.
Payout ratio <= 80%
Market cap >= 300M
This is a basic dividend shortlist. A high yield alone is not enough. The payout filter helps avoid names where the dividend may be less reliable.
Hybrid screens
Hybrid screens combine technical and fundamental filters. This is usually the most practical workflow for traders who care about both quality and timing.
Example hybrid screen:
[close > SMA(50)] AND [volume > 250000]
Fundamental:
Market cap >= 500M
ROE >= 10%
Revenue growth >= 5%
This screen is stricter than a pure chart screen. It asks for tradeability and business strength at the same time.
Text to query
The Text to query panel lets you describe a screen in plain English. It can convert the request into technical and fundamental conditions.
Example prompt:
After conversion, review the generated rules. Make sure the conditions match what you meant. Then run the screen and check the result readout. A converted screen is only useful if the resulting matches make sense.
Screenshot placeholder: Text to query panel after conversion, with generated technical and fundamental rows.
Run the screen
Click Run screen after your rules are ready. The Advanced Screener page shows a result preview first. Use this preview to check whether your filter is too broad, too narrow, or clearly wrong.
If the preview looks good, open the detailed table. The full Results page gives you the better review experience.
Screenshot placeholder: Advanced Screener result preview with matched rows and the Open detailed table action.
Review the Results page
The Results page shows the matched rows and the readout that explains the list.
The main columns are:
- Symbol: Ticker and company name.
- Price: Latest available EOD price.
- Move: Latest move.
- Score: Setup quality score based on price move, volume, liquidity, trend, and available evidence.
- Trend: Current trend state.
- Why matched: The evidence that explains why the symbol is in the table.
- Review: Link to Symbol Review.
Screenshot placeholder: Results table with score, trend, why matched, and review action.
The right rail shows queues:
- Priority: Higher-score candidates.
- Watchlist-ready: High liquidity and normal risk.
- Risk review: Names that need extra checking before planning.
Example: a value screen may return 99 rows, but the Watchlist-ready queue may narrow that to 54. Start with the smaller queue if you only have limited time.
Use chart view
Results can switch between Table and Charts. Chart view is useful when you want to quickly compare the structure of multiple symbols. You can use the chart toggles from the screener setup to show rule indicators, volume, and SMA overlays.
Screenshot placeholder: Results chart view showing multiple chart cards with review actions.
Use Table view for sorting and evidence. Use Chart view for structure and visual confirmation. Do not let chart view replace the evidence column. A symbol still needs to match the rule set.
Save the screen
Click Save screen in Advanced Screener when you have a setup you expect to reuse. Saved screens appear under Saved Screeners.
A good saved screener name is specific. Use names like:
- US liquid 50 SMA momentum
- Quality growth above 50 SMA
- Dividend yield payout review
- Value PE under 25 with positive EPS
Bad names like "test" or "screen 1" make the saved screener table harder to use later.
Create a watchlist
You can create a watchlist from Advanced Screener or Results. This saves the matched rows as a watchlist so you can analyze and review them later.
Example flow:
- Open Screen Library.
- Choose 20-Day High With Volume.
- Open View matches.
- Switch to Watchlist-ready.
- Click Create watchlist.
- Open the new watchlist and add notes like "Review only if still above 50 SMA tomorrow."
Export to TradesViz planning
The Results page has a TradesViz plan action. This exports a CSV with the matched symbols and their screen context. The export includes fields like symbol, market, setup, score, last price, move, trend, liquidity, risk, why matched, notes, and an EZSS review path.
This keeps the planning context attached to the idea. When you review or journal the trade later, you can see why the symbol was selected in the first place.
A complete example
Here is a full practical screener example:
- Open Advanced Screener.
- Select market US.
- Name the screen US quality momentum review.
- Add technical rules: [close > SMA(50)] and [volume > 250000].
- Add fundamental rules: ROE >= 10%, Revenue growth >= 5%, and Profit margin >= 5%.
- Set liquidity to Medium or better.
- Set risk state to Normal.
- Run the screen.
- Open the detailed table.
- Review the Priority and Watchlist-ready queues.
- Open Symbol Review for the top names.
- Create a watchlist or export a TradesViz plan CSV.
The important part is not the exact rules. The important part is the process: define the setup, check the evidence, narrow the queue, save only what is worth tracking, and keep the reasoning attached.