
The v2 Backtests page helps you answer a direct question: did this screen produce useful historical signals under a simple entry and exit rule?
It is not meant to replace judgment, risk management, or execution review. It is meant to stop you from trusting a screen just because it sounds good. If a screen is going to become part of your routine, you should know how it behaved before.
Screenshot placeholder: Backtests page showing Step 1 setup controls, Step 2 setup table, Step 3 review selected setup, and run history.
The v2 backtest flow
The page is split into three main steps:
- Set market, range, entry, and exit.
- Choose a setup.
- Review and run the backtest.
This structure keeps the important choices visible before you run anything. A backtest result only makes sense when you know the market, date range, entry rule, exit rule, and screen logic that produced it.
Step 1: Set market
The market selector supports US, Canada, India, and Australia. Pick the same market you use in your screen workflow.
Example: if you created a watchlist from US results, run the backtest with market US. Do not compare a US setup with a different market unless that is the test you intentionally want to run.
Step 1: Set range
The range selector supports:
- 1 year: Good for a normal daily swing validation pass.
- 6 months: Useful when you only care about the current market regime.
- 2 years: Better when you want a longer sample.
- Custom dates: Use this when you want to isolate a specific period.
Screenshot placeholder: Backtest range picker showing 1 year, 6 months, 2 years, and Custom dates.
Example: if market conditions changed sharply in the last few months, run a 6-month backtest first. If the screen still looks reasonable, run the 2-year version next to check whether the result is only a recent effect.
Step 1: Set entry
The entry selector controls when the backtest enters after the screen finds a match.
- Buy next open: Enter at the next open after the signal.
- Buy next close: Enter at the next close after the signal.
- Buy same close: Enter at the same close as the signal.
Example: if you run scans after the market close and plan trades the next morning, Buy next open is the closer assumption. If your process only acts after another closing confirmation, Buy next close may be more realistic.
Step 1: Set exit
The exit selector controls when the backtest exits.
- Exit after 5 trading days: Short holding-period test.
- Exit after 10 trading days: Medium short-term swing test.
- Exit after 20 trading days: Longer swing test.
- Exit when below 20 SMA: Signal-based exit for faster trend weakness.
- Exit when below 50 SMA: Signal-based exit for wider trend weakness.
- Exit on saved screen: Use a saved technical screener as an exit signal.
Screenshot placeholder: Backtest exit picker showing time-based exits, SMA exits, and saved exit screens.
Example: if your entry is a breakout, compare Exit after 10 trading days with Exit when below 20 SMA. The first tells you whether the signal had short-term follow-through. The second tests whether a simple trend failure exit improves or hurts the result.
Step 2: Choose a setup
After setting the market, range, entry, and exit, use the setup table. This table can show system examples and saved screeners. You can search setups or tags, switch source tabs, sort columns, and select the setup you want to run.
Screenshot placeholder: Backtest setup table with example and saved screener rows.
Built-in example setups include technical, fundamental, and hybrid styles such as:
- Momentum high-volume breakout: close > 5, volume > 100000, close > SMA(50).
- Uptrend pullback to 50 SMA: close > SMA(200), close < SMA(50), volume > 100000.
- Above 50 and 200 SMA trend: close > SMA(50), close > SMA(200), volume > 250000.
- Bullish golden cross: SMA crossover style signal with volume filter.
- Bullish MACD crossover: MACD crossover style signal.
- RSI oversold reversal: RSI reclaim after oversold behavior.
- Volume expansion breakout: Positive price action with volume expansion.
- Bollinger lower-band reclaim: Mean reversion style setup.
- Quality growth fundamentals: Market cap, ROE, margin, and revenue growth filters.
- Reasonable PE value: Positive earnings with a PE ceiling.
- Dividend income discipline: Yield and payout checks.
- Strong balance sheet: Current ratio, debt/equity, margin, and market cap checks.
If you already saved your own screen, use the saved setup source. This is usually more useful than running generic examples because it validates your actual process.
Step 3: Review selected setup
The selected setup panel shows the screen name, entry, exit, range, source, tags, and rules preview. Read this before clicking Run backtest.
Screenshot placeholder: Selected setup panel showing screen, source, range, entry, exit, and rules preview.
This review step prevents a common mistake: running a backtest with the wrong exit or an old screen selection. If the setup summary does not match your intent, change it before running.
Run the backtest
Click Run backtest to save and execute the run. V2 saves the execution in run history. Some runs may queue and show a running status before results are available.
The run history table shows:
- Run ID and created time.
- Screen name and selected range, entry, and exit.
- Symbol count.
- Return.
- Win rate.
- Status.
- Open action.
Screenshot placeholder: Run history table with completed and running backtest rows.
Backtest run detail
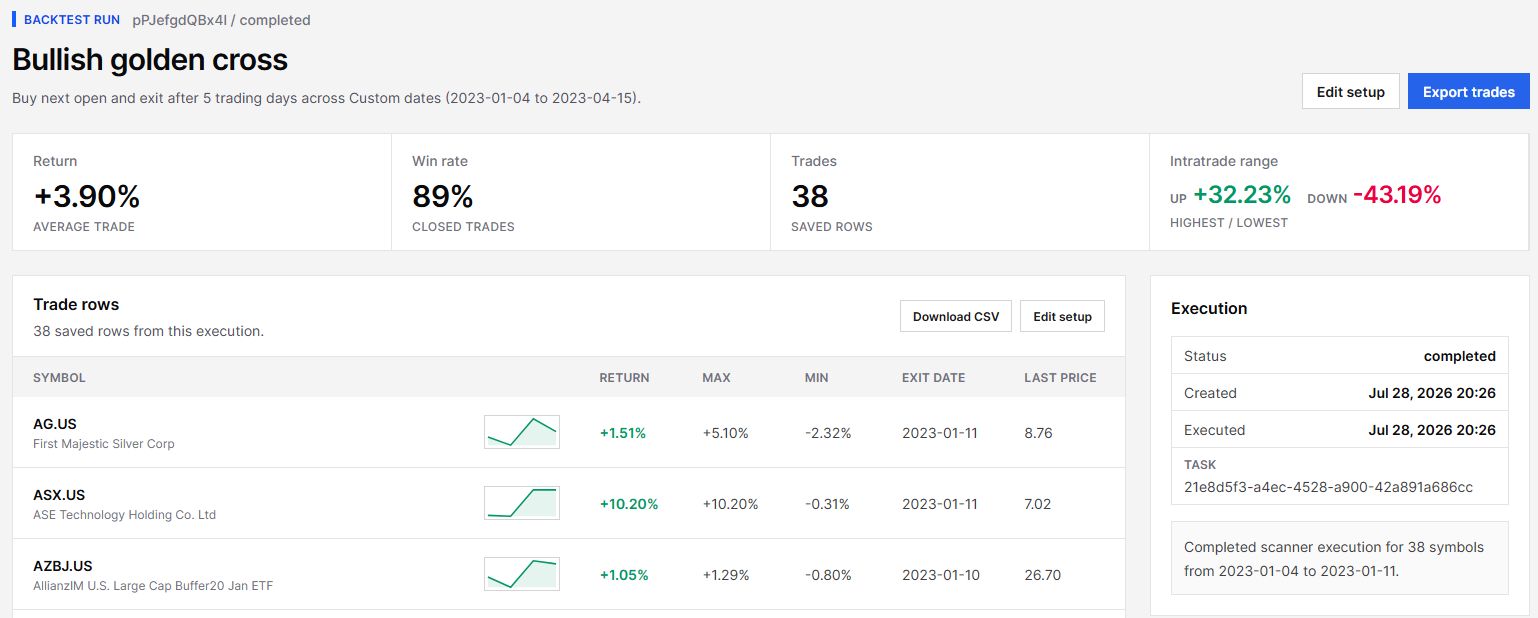
Open a run to see the detail page. It shows the run status, summary metrics, saved trade rows, execution details, verdict, best and worst symbols, scanner match count, and setup details.
Screenshot placeholder: Backtest run detail page with summary metrics, trade rows, verdict, and setup panel.
The trade rows table includes:
- Symbol: The matched stock.
- Return: Result for that row.
- Max: Best move during the test window.
- Min: Worst move during the test window.
- Exit date: Date when the exit rule closed the test.
- Last price: Latest available price shown for context.
The detail page also supports CSV export. Use this when you want to inspect the rows outside the app or compare several runs.
Example 1: Momentum breakout test
Goal: check whether a high-volume momentum screen had useful short-term follow-through.
- Market: US.
- Range: 1 year.
- Entry: Buy next open.
- Exit: Exit after 10 trading days.
- Setup: Momentum high-volume breakout.
- Run the backtest.
What to look for:
- Average return.
- Win rate.
- Worst symbol.
- Whether returns are driven by only one or two large winners.
- Whether the trade count is large enough to care about.
If the result looks promising, rerun the same setup with Exit when below 20 SMA. If the signal-based exit improves drawdowns without destroying returns, it may be worth deeper review.
Example 2: Pullback test
Goal: check whether pullbacks to the 50 SMA work better with a fixed holding period or a moving-average exit.
- Market: US.
- Range: 2 years.
- Entry: Buy next close.
- Exit: Exit when below 50 SMA.
- Setup: Uptrend pullback to 50 SMA.
- Run the backtest.
Then run the same setup with Exit after 20 trading days. Compare the return, win rate, and worst rows. This gives you a cleaner idea of whether the exit rule is helping.
Example 3: Fundamental quality test
Goal: check whether quality fundamentals become more useful when combined with liquidity and basic price filters.
- Market: US.
- Range: 1 year.
- Entry: Buy next open.
- Exit: Exit after 20 trading days.
- Setup: Quality growth fundamentals.
- Run the backtest.
For this kind of screen, do not only look at return. Also check whether the names were tradeable, whether the weak rows had common problems, and whether the screen is better used as a watchlist generator rather than a direct entry signal.
Use saved exit screens
Saved exit screens are useful when your exit rule is more specific than a time-based exit or a simple SMA break.
Example exit screener:
OR [RSI(14) < 45]
Save that as a technical screener, then select it as the exit. This lets you test an exit logic that fits your process.
How to interpret a backtest
A backtest is a filter for ideas, not a promise. Use it to reject weak concepts quickly and to decide what deserves more testing.
Watch for these problems:
- Too few trades: A great result with a tiny sample can be noise.
- One winner dominates: Check the trade rows, not only the summary.
- High return with ugly drawdowns: It may not fit your risk tolerance.
- Unrealistic entry assumption: Pick the entry timing that matches your real workflow.
- Exit mismatch: A weak exit can make a good screen look bad, and a lucky exit can make a weak screen look better than it is.
A practical backtest routine
- Start with a screen you actually plan to use.
- Run a 1-year test with your most realistic entry and exit.
- Run a 6-month test to check the current market regime.
- Run a second exit rule for comparison.
- Open the run detail and inspect the worst symbols.
- Export the trades if you want to compare several runs.
- If the screen still makes sense, use it to build a watchlist and track outcomes in TradesViz.
The best use of backtesting is not to find a perfect number. It is to create enough evidence that your screen deserves your time.