
EZStockScreener v2 is built around a simple daily workflow: start with a market view, open a screen, review the matched stocks, save the names you want to track, validate the idea with a backtest, and move the planning context into TradesViz.
The older version of EZStockScreener was mostly a powerful query builder. That is still available, but v2 moves the most common work to a cleaner research desk. You do not have to start by writing indicator syntax. You can start from ready-made screens, use the builder when you need more control, and keep the output connected to watchlists and planning.
Screenshot placeholder: Full EZStockScreener v2 app shell showing the left sidebar, top global search, Market Pulse page, profile menu, and dark mode toggle.
The v2 layout
The main layout has three areas:
- Left navigation: Market Pulse, Screen Library, Advanced Screener, Saved Screeners, Watchlists, Indicator Reference, Fundamental Metrics, and Backtests.
- Top bar: Global search, loading/data status, account menu, and theme toggle.
- Main workspace: The active page, usually built around tables, result queues, and symbol review actions.
The sidebar can be locked open on desktop. On mobile, it opens from the menu button and closes after you pick a page. This keeps the app usable on smaller screens without hiding the main data behind a large nav.
Market Pulse
Market Pulse is the best starting point for most users. It answers the basic question: what is worth reviewing today?
The page starts with market tabs for US, Canada, India, and Australia. Each market shows updated EOD context, breadth metrics, and a few daily screen groups. These screen groups can include momentum, pullbacks, quality fundamentals, reasonable value candidates, dividend income candidates, and risk or weakness screens.
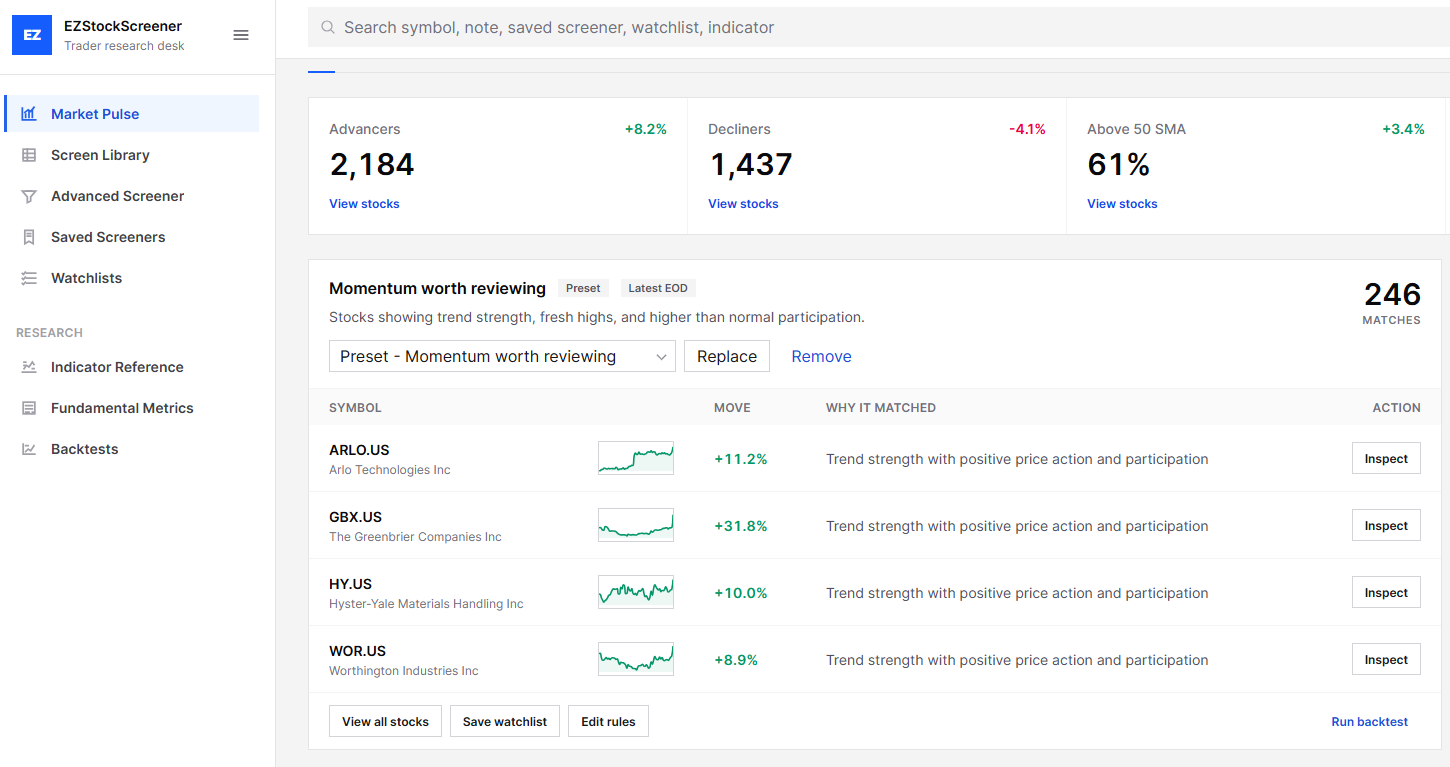
Screenshot placeholder: Market Pulse page with market tabs, breadth metric strip, and daily screen groups.
A typical Market Pulse card shows:
- The screen name, for example Momentum worth reviewing.
- The data source, such as EOD or fundamentals.
- The match count.
- A small table of top symbols.
- A short reason for each match.
- Actions to view all stocks, save a watchlist, edit rules, or run a backtest.
Example: if the momentum section shows NVDA.US with the reason "20-day high, volume 1.9x average", you can inspect the symbol, open the full result table, or turn the group into a watchlist for later review.
Screen Library
Screen Library is the curated starting point. It is where you go when you know the type of setup you want, but do not want to build every condition manually.
The library has category filters like Momentum, Pullback, Quality, Growth, Profitability, Valuation, Cash Flow, Balance Sheet, Dividend, Risk, and TradesViz. It also has mode filters for Technical, Fundamental, and Tech + fundamentals screens.
Screenshot placeholder: Screen Library page showing category filters, mode filters, search, and several screener cards.
Each library card shows the screen purpose, difficulty, best use case, current match count, a short backtest summary, rule set, and actions. The important actions are:
- View matches: Open the v2 results table.
- Customize: Open the screen in Advanced Screener.
- Run backtest: Start historical validation with the selected setup.
Example: choose Quality Growth in Uptrend if you want profitable growth names that also pass trend and liquidity checks. Choose Weak Trend Risk Review if you want to avoid or separately review weak names.
Advanced Screener
Advanced Screener is the custom builder. It is for users who want to define their own technical, fundamental, or hybrid screens.
The top of the page has setup controls: market, preset, base screener, screen name, minimum score, liquidity, risk state, screen date, and chart options. The builder then separates the conditions into two columns:
- Technical: Price, volume, moving averages, RSI, MACD, crosses, and other indicator rules.
- Fundamental: Revenue growth, margins, ROE, PE, market cap, debt, dividend, cash flow, and related company metrics.
Screenshot placeholder: Advanced Screener showing the Text to query panel, setup controls, technical builder, and fundamental builder.
Each column has a Builder view and a Text view. Builder view is easier for most users. Text view is useful when you already know the query syntax or want to paste a condition quickly.
Example technical rule:
Example fundamental rule set:
ROE >= 10%
Revenue growth >= 5%
Profit margin >= 5%
The page also includes Text to query conversion. You can describe a screen in plain English, and the system converts it into technical and fundamental conditions. This is a helper, not a replacement for review. After conversion, read the generated rules, adjust them, then run the screen.
Results
Results is where v2 becomes useful. A result page is not just a list of tickers. It shows why each stock matched, how it ranks, and what to do next.
Screenshot placeholder: Results page showing summary metrics, matched symbols table, result insights, and the selected symbol side panel.
The main table shows symbol, price, move, score, trend, and why matched. You can switch between Table and Charts view. Table is better for scanning. Charts are better when you want to quickly compare structures across many symbols.
The right panel shows result insights. It separates the result set into queues such as Priority, Watchlist-ready, and Risk review. This is important because a large screen result is not automatically a trade list. It is a research queue.
Example: a screen may return 99 stocks, but only 54 may be watchlist-ready because they also have stronger liquidity and normal risk. That makes the next step much clearer.
Symbol Review
Clicking a result row opens Symbol Review. This page keeps the screen context while giving you a deeper view of one symbol.
Screenshot placeholder: Symbol Review page with decision cards, chart, technical readout, matched evidence, fundamentals, company profile, and symbol note.
Symbol Review includes:
- Last price, move, trend, risk, and score.
- A chart with price history and default studies.
- Technical readout and liquidity information.
- Matched evidence from the screen.
- Review checklist items.
- Fundamental metrics and company profile when available.
- A symbol note area.
- Actions to save the symbol, go back to results, run a backtest, or export a TradesViz plan CSV.
Example: if AAPL.US matched a pullback screen, Symbol Review lets you check whether the pullback is still above the long-term trend, whether liquidity is clean, and whether there are any risk flags before you save it.
Saved Screeners
Saved Screeners is where repeatable work lives. It lists technical and fundamental screeners saved in your account. You can search by screener name, tags, or rules.
Screenshot placeholder: Saved Screeners page with saved screener table and selected screener detail rail.
When you select a saved screener, the detail rail shows modified date, created date, tags, saved controls, rule preview, current EOD match preview, quick queues, and next actions. You can run the screener, open the results table, create a watchlist, edit the logic, or duplicate the screen.
Watchlists
Watchlists are for names you want to continue reviewing after the screen. You can create them manually, from a results table, from a saved screener preview, or from a single symbol review.
Screenshot placeholder: Watchlists page with saved lists, selected watchlist details, symbol list, analysis status, and review queues.
A watchlist can store symbols, tags, and notes. It can also be analyzed against latest EOD data. After analysis, the page highlights sector mix, strongest names, and risk-review names.
Example: create a watchlist called US momentum review with symbols like NVDA.US, MSFT.US, AMD.US. Add tags such as momentum, weekly-review. Run analysis, then start with the strongest names before checking the risk list.
Backtests
Backtests are for validating a screen before you build a routine around it. The v2 backtest page is split into steps.
- Set market, range, screen, entry, and exit.
- Choose a backtest setup from examples or saved screeners.
- Review the selected setup and run it.
Screenshot placeholder: Backtests page showing Step 1 setup controls, Step 2 setup table, Step 3 selected setup, and run history.
The run history keeps past executions. A run detail page shows status, summary metrics, trade rows, verdict, best and worst symbols, setup details, and CSV export.
Indicator Reference and Fundamental Metrics
The Research section has two reference pages.
Indicator Reference is for technical syntax. Search for RSI, SMA, volume, cross, and similar functions. Each row shows the indicator, category, syntax, and examples where available.
Fundamental Metrics is for business and financial fields. Search for revenue, margin, debt, dividend, PE, ROE, cash flow, or other company metrics. The page groups fields by category and links back into the builder.
Screenshot placeholder: Indicator Reference and Fundamental Metrics pages side by side, showing category filters and search results.
Global search
The search bar at the top of the v2 shell is a global search. It can return symbols, symbol notes, screen library matches, saved screeners, watchlists, indicator reference entries, and fundamental metric entries.
Example searches:
- AAPL to open symbol review.
- RSI to find technical reference entries and screen library items.
- dividend to find dividend screens, watchlists, or fundamental fields.
- ROE to find fundamental metrics and quality screens.
A practical daily flow
Here is a clean way to use v2 without overcomplicating the process:
- Open Market Pulse for your market.
- Open a daily screen like Momentum, Pullbacks, or Quality.
- Use Results to narrow the list with Priority or Watchlist-ready queues.
- Open Symbol Review for the names that actually look interesting.
- Save the best names to a watchlist.
- Run a simple backtest if the screen is new to you.
- Export the selected plan CSV for TradesViz planning and journaling.
The key point is simple: v2 is not trying to make every matched symbol look important. It is trying to help you move from broad discovery to a smaller, documented review list.