How to create a screener
Introduction to UI
In this blog post, we will go over how to construct scanners, the syntax for indicators, and more. Don't be intimidated by all the code-like commands on the indicators page! Once you understand the basic structure of how to convert a plain English query to an EZstockscreener query, you'll be constructing super complex queries to find golden stock trading opportunities in no time!
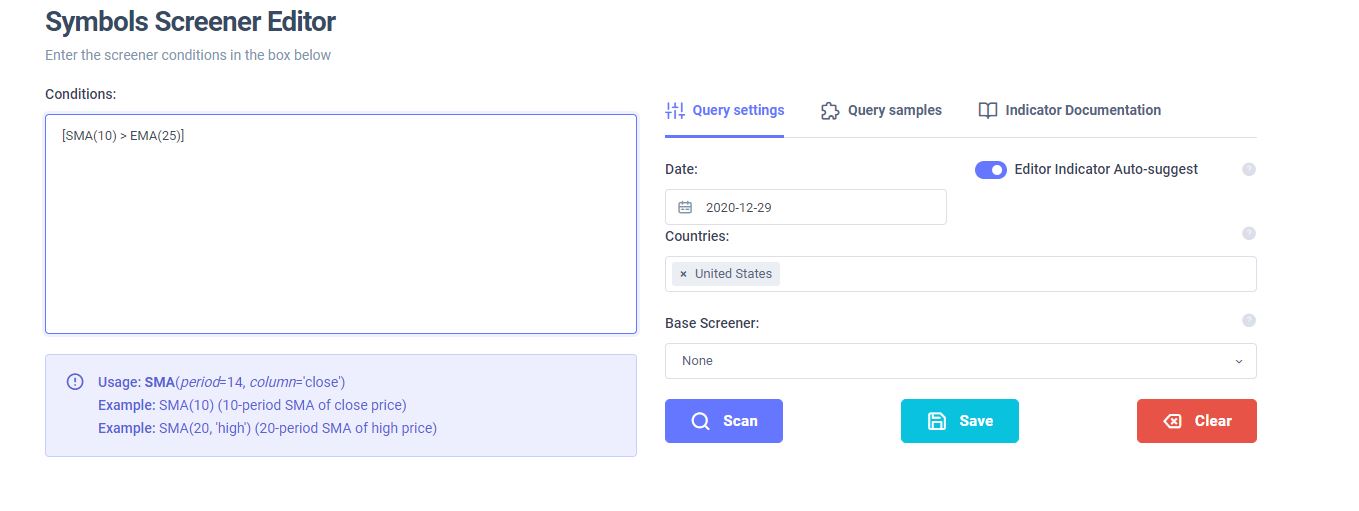
First, let's look at the UI and understand the parts. Below is the dashboard you will see when you access the create scanner page.
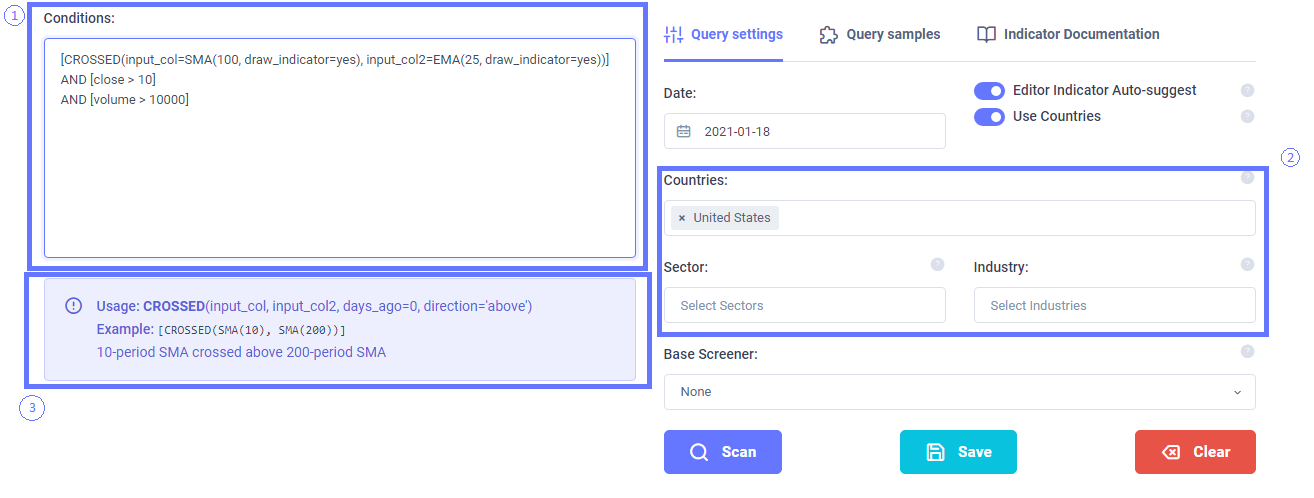
Let's split this into 3 sections:
- This is the area where you will enter the screener code. You might also notice that there are popups that appear as you type to suggest indicators similar (in text) to what you are trying now. If you do not need this, you can disable this by clicking on the editor auto-suggest toggle on the right side.
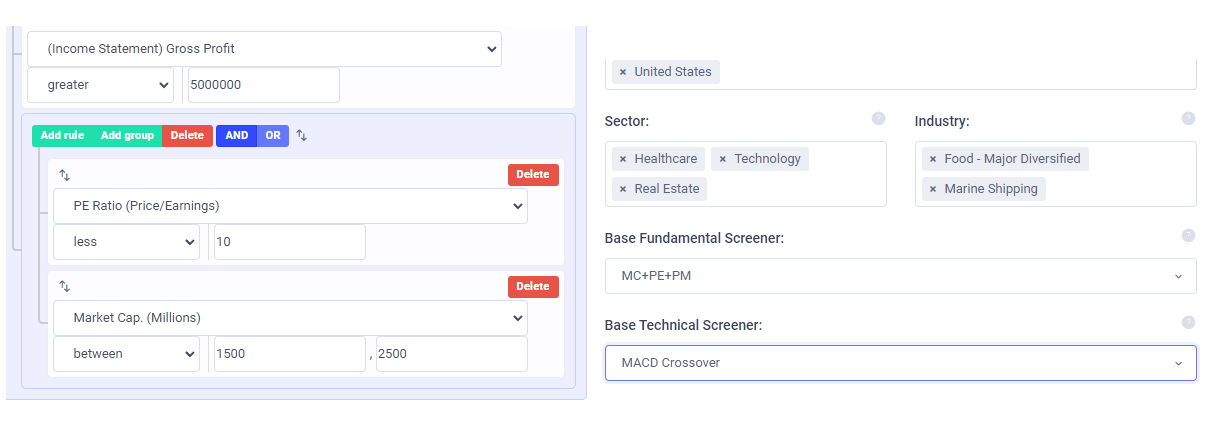
- These are the generic filters that are applicable to all screeners. Country/exchange, sectors, and industries are all dropdowns from which you can select to narrow down your search. Note that you can only either select countries (which means ALL exchanges of a country will be considered) or exchanges specifically. The other option is including a base screener which we will discuss in the later section.
- Finally, the documentation/infobox is where you will see all the syntax information about a particular indicator and how to use it including all its parameters. Parameters here are the input to indicators - like time period is a parameter to SMA. Note that each indicate comes with its own set of default and required parameters. We will discuss more about this in the following sections. This box will change it's contents based on where your cursor is at the moment. If you want. In the example above, the cursor is set on CROSSED indicator.
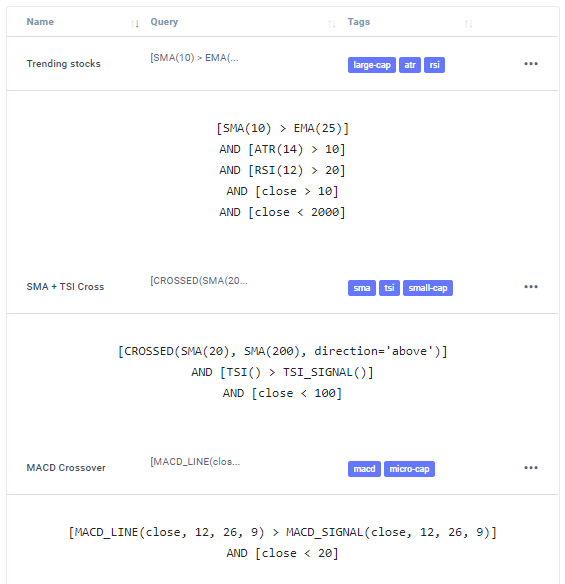
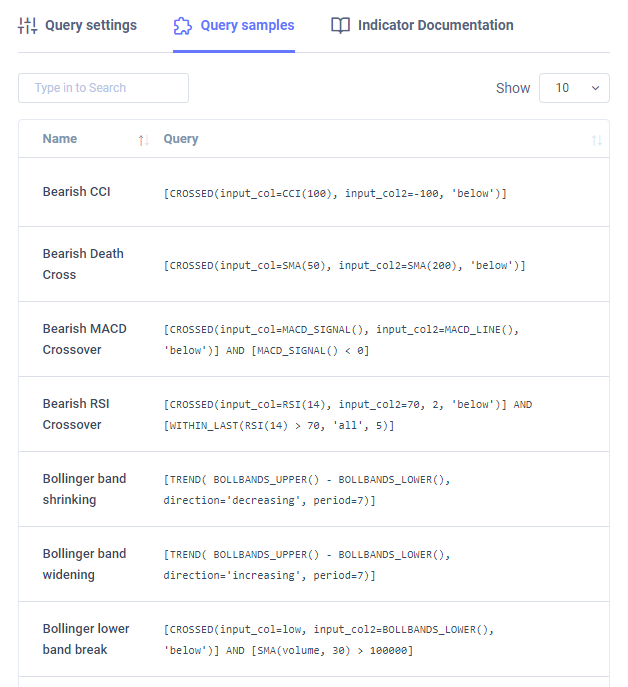
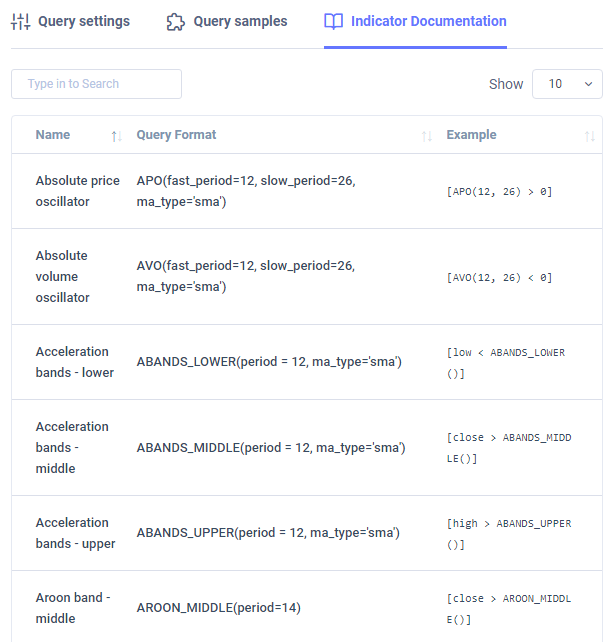
The other main component is the 3 tabs at the top. Query settings are what you currently see (default) and the 2 other tabs exist to give you more info and ideas about what is possible with EZstockscreener. Here are some examples of the what you would see in the other tabs:
Writing and saving indicators
The crux of EZstockscreener - writing creative queries to find those hidden stocks to profit from! In this section, we will go through simple examples of query building starting from a plain English version to converting it to an EZstockscreener query.
The first example is that of "finding stocks where the close price is over $10 and volume is over 10,000 and also the 100-period SMA has just crossed below 25-period". This could be a scan to look for stocks that are at the beginning of a downtrend. Let's translate this to the EZstockscreener query by splitting the query into 3 parts:
- close price is over $10 --> close > 10
- volume is over 10,000 --> volume > 10000
- 100-period SMA has just crossed below 25-period:
- This is a bit complex so let's break it down further:
- 100-period SMA --> SMA(100)
- 25-period EMA --> EMA(25)
- Combining the above into a wrapper called CROSSED which checks if 2 time-series (basically sets of columns) have intersected --> CROSSED(input_col=SMA(100), input_col2=EMA(25), direction=below)
- Note that I've underlined the parameter names and bolded the actual parameters. Think of this as a box where you feed it in a set of named instructions and it gives you the result you want - simple!
- This is a bit complex so let's break it down further:
The final query would be combining the above with square brackets for each condition:
AND [volume > 10]
AND [CROSSED(input_col=SMA(100), input_col2=EMA(25), direction=below)]
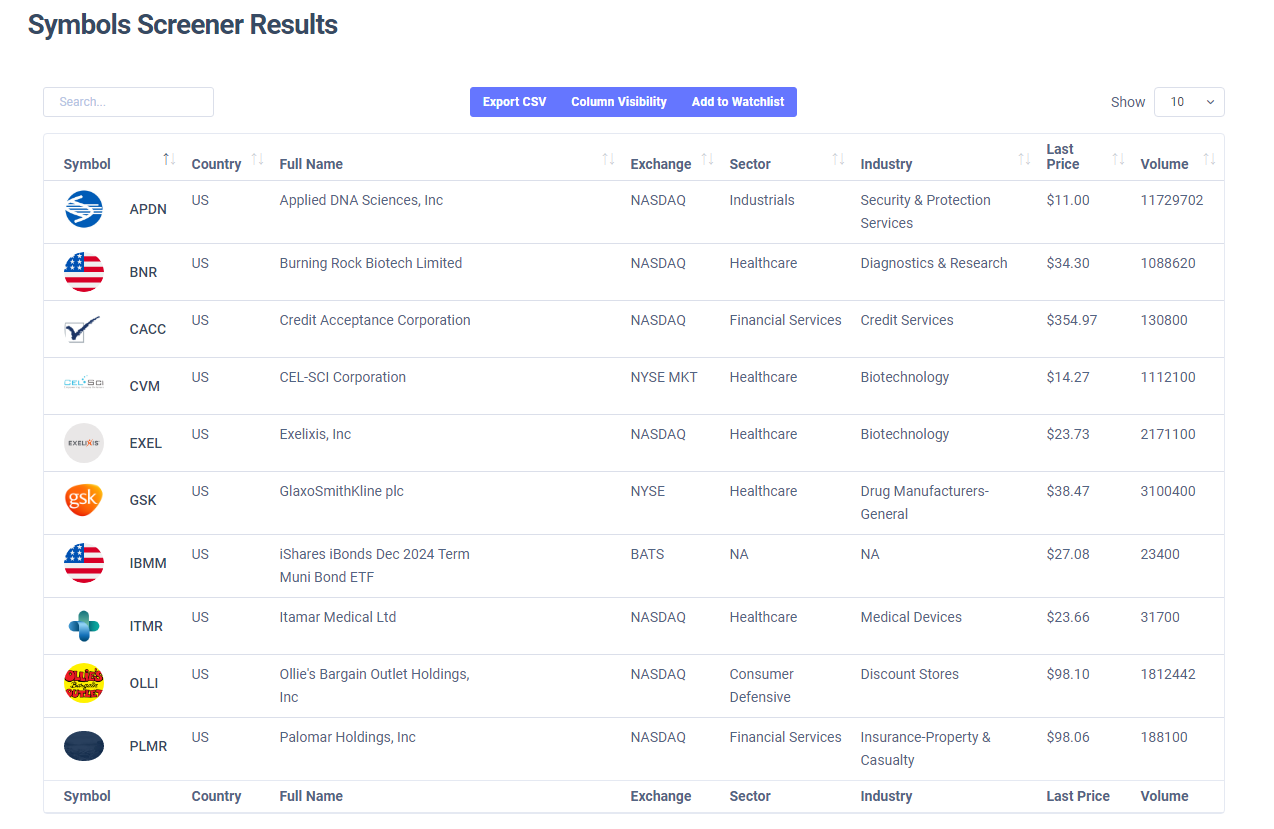
Enter this into the screener input box, click scan and you're done! The EZstockscreener system will scour 10,000+ stocks and get you the results:
This is how EZ ;) it is to search for stocks every single day with EZstockscreener. Take a look at the screener example tab to get more ideas on how to combine screeners and create more complex screeners that fit your trading style. Use the base screener to apply common screener settings. An example use-case would be to use a specific set of price/volume profile screeners and use them whenever you are either day trading or swing trading to only show stocks above or below specific price levels. All it does is, apply another filter on top of the filter you are currently executing - it's simple!
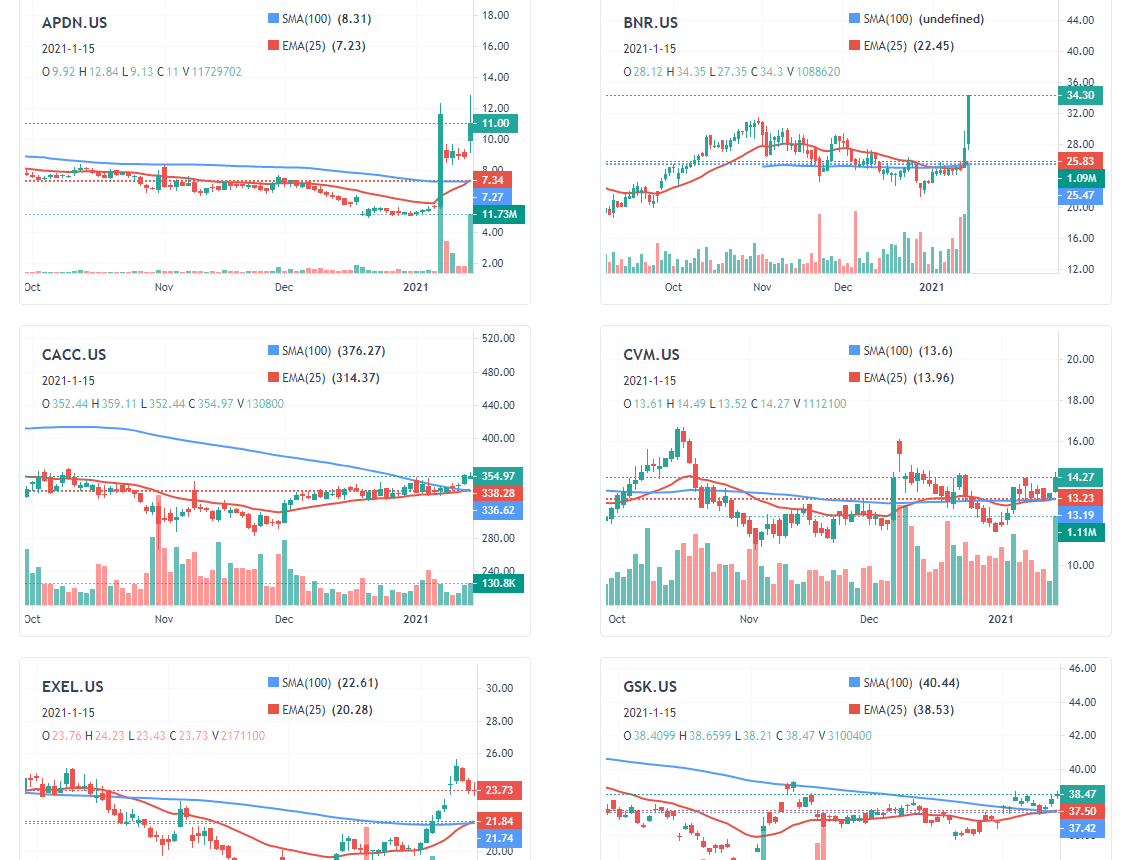
If you're wondering how the indicators were drawn, that's also simple - you get to decide what indicators to draw and what not to draw. simply add the parameter 'draw_indicator=yes' to (almost) any indicator and you will see the indicator drawn on the charts!
That's it for the basic screener constructions tutorial! Stay tuned for more complex indicator construction walkthrough and strategy guides!
If you need any help with constructing indicators, let us know via email: [email protected].